Want to improve your proposal success rates on platforms like Upwork? Benchmarking proposal response rates by niche is the key to moving from guesswork to actionable strategies. This guide breaks down how to analyze your data, compare it to industry standards, and refine your approach for better results.
Key Takeaways:
- Why Benchmarking Matters: Helps identify weak spots in your sales process and improve resource allocation.
- Metrics to Track: Focus on Reply Rate, Shortlist Rate, Win Rate, Revenue per Proposal (RPP), and Speed-to-Lead.
- Industry Benchmarks: Reply rates vary by niche (e.g., Local Services: 35-45%, Web Development: 20-30%, Enterprise: 16-24%).
- Data Collection: Use a 60-90 day window with 50-150 proposals for meaningful insights.
- Practical Tips: Submit proposals within 30-90 minutes of job postings, use niche-specific language, and test proposal quality with a 1-5 scoring system.
By following these steps, you can set clear targets, refine your strategy, and consistently improve your proposal outcomes.
How I Land 30% Response Rates on Upwork!
sbb-itb-5c5517e
Step 1: Define Key Metrics for Benchmarking
Before diving into benchmarking, it’s crucial to establish clear metrics. These metrics turn raw numbers into actionable insights, helping you spot trends, identify gaps, and make meaningful comparisons within your niche.
Metrics to Track
Focus on tracking three key funnel stages: Reply, Shortlist (Interview), and Win (Hire). Each provides a window into your performance:
- Reply Rate: This is calculated by dividing the number of substantive client messages (like clarifying questions or interview requests) by the total number of proposals you’ve sent. Automated responses don’t count here.
- Shortlist Rate: This measures the percentage of proposals that lead to interviews or detailed project discussions. It reflects how well your proposal communicates credibility and aligns with client needs.
- Win Rate: This metric shows how many funded contracts you’ve secured compared to the number of proposals sent. It’s a direct indicator of how effectively you’re converting opportunities into actual work.
In addition to these funnel metrics, consider tracking Revenue per Proposal (RPP). This metric offers a more detailed look at the value each proposal generates, going beyond just win rates.
Another important factor is Speed-to-Lead – the time (in minutes) between a job being posted and your proposal submission. Proposals submitted within the first 60–90 minutes tend to perform better, as response rates often drop after this window or once more than 10 competitors have bid. Lastly, use a Proposal Quality Score (PQS) – a simple 1–5 scale that evaluates critical elements like your hook, plan, proof, fit, and call-to-action. A low PQS can help pinpoint whether poor response rates are due to niche challenges or the quality of your proposal.
How to Standardize Data Collection
Once you’ve defined your metrics, it’s essential to standardize your data collection process. Reliable benchmarking requires consistency. Use a rolling 60–90 day window or wait until you’ve sent at least 50–150 proposals within a specific niche before drawing conclusions. Smaller sample sizes can lead to misleading results.
Avoid averaging metrics across unrelated niches or budget tiers. For example, high-volume, low-cost niches can distort benchmarks for more premium services. Instead, segment your data by niche (or "Lane", such as Web Development vs. SEO) and Budget Tier (e.g., Micro, Starter, Core, Strategic).
Set up a centralized tracker with standardized columns, such as:
- Date/Time Sent
- Lane (Niche)
- Budget Tier
- Post Age at Send
- Proposals Already Submitted
- Outcome markers (Reply, Interview, Win)
Update your tracker immediately after sending a proposal to ensure data accuracy. Be sure to exclude auto-withdrawn or accidental submissions, as these can skew your percentages. Maintaining clean and precise data is critical for drawing meaningful insights.
With your metrics defined and a consistent data collection process in place, you’re ready to move on to organizing and analyzing your proposal data in Step 2.
Step 2: Collect and Organize Proposal Data
Now that you’ve outlined your metrics, the next step is gathering and organizing your data. Since Upwork doesn’t provide a built-in tool for exporting detailed proposal analytics, you’ll need to create your own system. A straightforward spreadsheet with about 20 columns can do the trick, capturing everything from basic details to proposal performance and outcomes.
Export Data from Upwork
Start by reviewing and logging your most recent 30–50 proposals from your Upwork history. This will serve as a baseline for analysis. Your spreadsheet should include columns for administrative details like Date, Job ID or URL, Lane/Niche, Client Country, and Budget Type (e.g., Hourly or Fixed). You can also use an Upwork bidding calculator to ensure your targets remain profitable. Beyond that, track metrics such as time from job posting to proposal submission, proposal count at submission, word count, and outcomes (e.g., Reply, Interview, Hire, Revenue in USD). Don’t forget to log costs, including the Connects spent and the time taken to craft each proposal.
Aim to collect data over a 30–90 day period to identify meaningful patterns while filtering out short-term fluctuations. If you’re just starting out, log each new proposal immediately to ensure your records stay complete.
For a deeper layer of insight, consider adding a Proposal Quality Score (PQS) column. Rate each proposal on a 1–5 scale based on elements like your hook, plan, proof, fit, and call-to-action. This score can help you differentiate between challenges related to the niche itself and those tied to the quality of your proposals. Once your raw data is collected, you can begin categorizing it for more detailed analysis.
Segment Data by Niche
Organize your proposals by niche or "lane" (e.g., Content & SEO, Web Development, Design/UI-UX, eCommerce, Data & AI, Mobile). This segmentation allows you to apply your key metrics more accurately, as buyer behavior can vary widely between niches. For instance, a 25% reply rate might be excellent in a Data & AI niche but considered low for Local Services.
To refine your analysis further, include a Budget Tier column. Break projects into tiers such as Micro ($0–$499), Starter ($500–$1,500), Core ($1,500–$5,000), Growth ($5,000–$15,000), and Strategic ($15,000+). This distinction is crucial because high-volume, low-cost niches can skew benchmarks if grouped with premium services. For example, in the Content & SEO niche, Micro deals might achieve a 40% reply rate, while Strategic deals could sit around 18% – both of which are typical for their respective tiers.
Agencies that carefully track and analyze segmented proposal metrics have reported improvements in lead response rates of up to 150%. With your data now organized and segmented, you’re ready to measure your performance against industry standards.
Step 3: Compare Against Industry Benchmarks
Upwork Proposal Response Rate Benchmarks by Niche and Budget Tier
Once you’ve segmented your data, the next step is to measure your performance against industry standards. This comparison helps pinpoint areas where you’re doing well and where there’s room for improvement.
Find Benchmark Ranges by Niche
Reply rates vary significantly depending on your niche. For instance:
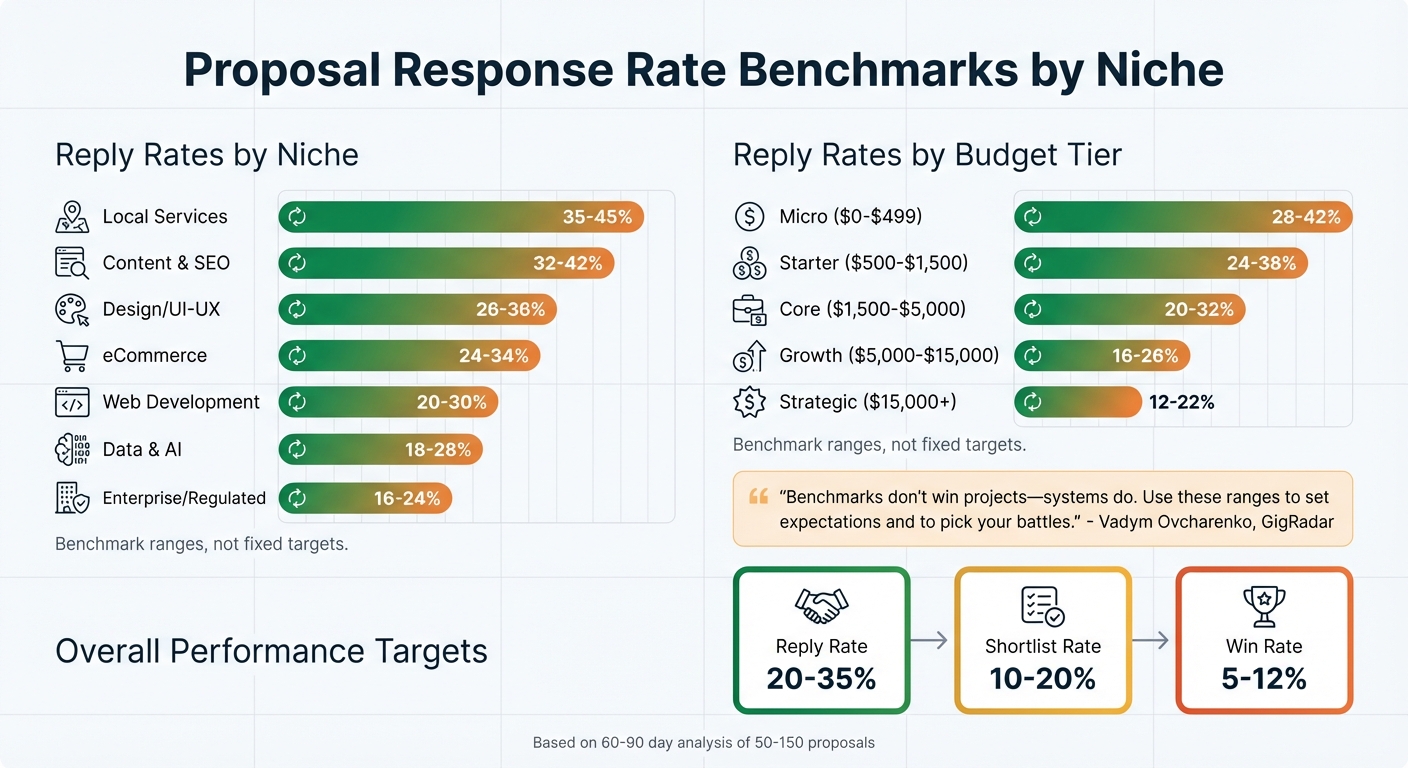
- Local Services (like SMB SEO or web design) often see reply rates of 35–45%.
- Data & AI projects (such as ML Ops or Analytics) usually fall between 18–28%.
- Content & SEO agencies can expect 32–42%, while Design/UI-UX teams typically see 26–36%.
- eCommerce specialists (Shopify, CRO) average 24–34%, and Web Development agencies (React, Next.js) generally achieve 20–30%.
- Enterprise or regulated projects tend to have the lowest reply rates, ranging from 16–24%.
Budget also plays a big role. For example, micro projects (valued at $0–$499) typically generate 28–42% reply rates, while strategic deals ($15,000+) often see much lower rates, around 12–22%. On average, a well-performing agency should aim for a reply rate of 20–35%, a shortlist rate of 10–20%, and a win rate of 5–12% across all niches.
"Benchmarks don’t win projects – systems do. Use these ranges to set expectations and to pick your battles."
- Vadym Ovcharenko, GigRadar
By comparing your results to these benchmarks, you can identify gaps and focus on areas needing improvement.
Create a Performance Comparison Table
A clear way to assess your performance is by creating a comparison table. Include these columns: Niche, Your Reply Rate, Benchmark Range, and Gap (%). Calculate the gap by subtracting the benchmark’s lower limit from your reply rate. For example, if your reply rate in Design/UI-UX is 15% (against a benchmark of 26–36%), your gap would be –11 percentage points, signaling a need for improvement.
It’s also helpful to include both reply rates and shortlist rates in your analysis. These metrics highlight different aspects of your performance. For instance:
- A reply rate below 15% might indicate that your initial message is too generic or that you’re submitting proposals too late. Aim to send proposals within 60 minutes of a project posting.
- If your reply rate is decent but your shortlist rate is low, it could mean your proof of expertise or project scoping needs work.
Analyze performance over a 60–90 day period, using data from 50–150 proposals, to account for short-term fluctuations. This will give you a clearer picture of where to refine your strategy and improve results.
Step 4: Analyze Gaps and Improve Strategies
Once you’ve compared your results to industry benchmarks, it’s time to zero in on specific gaps and refine your approach. Benchmark data provides a clear lens to spot areas in need of improvement and sharpen your proposal tactics.
Find Root Causes of Low Response Rates
Identifying gaps is just the beginning – you need to figure out why they exist. Many common issues follow predictable patterns. For instance, if your reply rate is under 15%, the usual suspects are submission speed or a generic opener. Slow submission times and intense competition often lead to missed opportunities for engagement.
Research shows that submitting a proposal more than 30 minutes after a job is posted can reduce reply rates by 5–10 percentage points. To stay competitive, monitor your "Speed-to-Lead" – the time it takes you to submit after a job goes live. The sweet spot for submission is often within 30–90 minutes.
Another common issue is generic language in proposals, which can make you appear less credible. To build trust, include niche-specific details and proof artifacts like case studies or screenshots. If your reply rate is solid but your shortlist rate is low, the missing piece might be these proof elements. Additionally, targeting the wrong jobs – where your portfolio doesn’t align with client needs – can waste time and effort by diluting your focus.
By digging into these root causes, you can make targeted adjustments that will improve your proposal success rates.
Improve Proposal Strategies
Once you’ve identified the gaps, it’s time to take action. Start by introducing bid sprints: set aside two or three daily windows to submit proposals within the first 60 minutes of a job posting. This ensures you’re engaging clients when they’re most receptive.
Fine-tune your opening sentences with the "Two-Specifics" Rule – reference at least two details from the client’s brief to show you’re paying attention and not using a generic template. Another key tactic is to define success in clear terms using a "Done = …" framework. For example, you might write: "Done = Fully functioning landing page with GA4 tracking." This kind of language reduces perceived risk and demonstrates that you understand their goals.
Avoid vague calls-to-action like "let’s chat." Instead, offer a choice-based CTA: "Would you prefer a 10-minute call or a 2-slide mini-plan?" This makes it easier for clients to engage with you. In niches with lower win rates, skip large custom builds and propose a micro-milestone – a small, 3–5 day project that lets clients test your capabilities without a big commitment.
"When you operate from data, you stop guessing. Upwork proposal analytics doesn’t make writing easy – it makes winning predictable."
- Vadym Ovcharenko, CEO, GigRadar
To measure your progress, use a Proposal Quality Score (PQS). Rate each proposal on a scale of 1–5 based on five criteria: Hook, Plan, Proof, Fit, and CTA. Conduct weekly A/B tests on a single variable – like testing "plan-first" versus "proof-first" openers – across 20–30 proposals. Look for a 20% improvement in your target metric to validate the change.
Step 5: Use Convertix.io for Automated Benchmarking
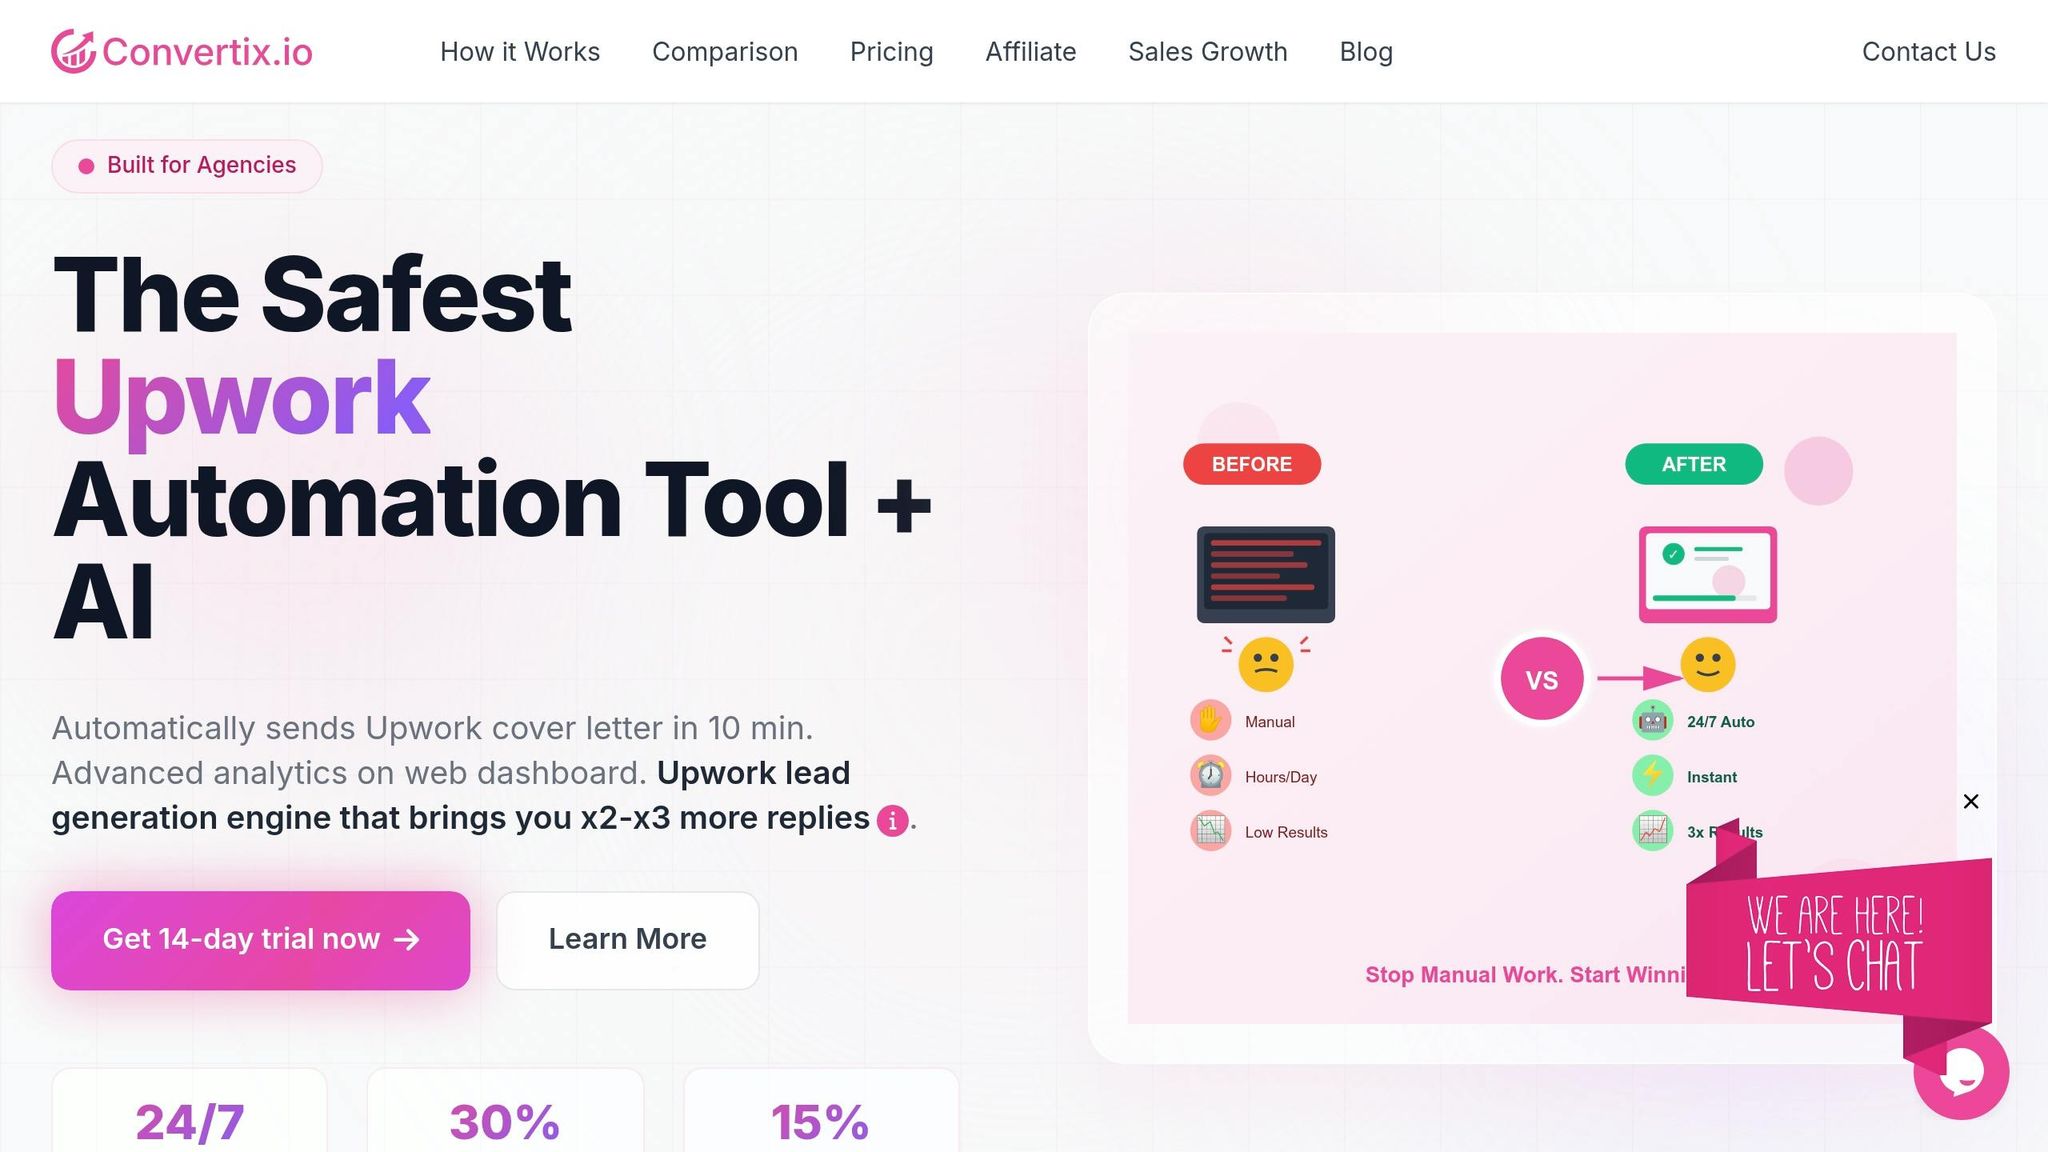
Benchmarking manually takes up a lot of time and energy. That’s where Convertix.io steps in, automating the entire process so you can focus on fine-tuning your proposal strategy. Designed specifically for Upwork agencies with up to 50 employees, this platform handles everything from job matching to proposal creation and performance tracking.
How Convertix.io Makes Benchmarking Easier
Convertix.io works around the clock, monitoring Upwork 24/7 and applying to new job postings in about 10 minutes. Its proposal generation system is portfolio-focused, meaning it automatically selects and highlights your most relevant past projects to align with client needs.
The platform’s Advanced Analytics Dashboard breaks down metrics like view, reply, and hire rates by job stream, cover letter template, and business manager. This combination of automation and analytics solves the challenge of niche-specific benchmarking. Users often report proposal view rates between 25–30% and reply rates of 5–15%, compared to the typical 5–7% from human lead generation managers.
Another standout feature is AI Job Validation, which goes beyond simple keyword matching. By setting filters based on tech stack, domain expertise, or other criteria, you can ensure your agency only applies to jobs that are a strong match.
"Convertix reduced our proposal workflow from 15 hours to about 3–5 hours per week and made scaling our Upwork outreach much easier."
- Zoha, Co-Founder, Skip The Noise Media
These tools make it easier to scale your agency’s operations, as outlined in the features below.
Features Designed for Growth
Convertix.io offers three pricing plans to fit different needs:
- Starter: $299/month for 300 proposals
- Advanced: $599/month for 600 proposals
- Bespoke: Custom pricing with unlimited proposals and tailored features
This pricing is far more affordable than manual vs. automated lead generation.
Key features include:
- Smart Job Filters: Use AND/OR logic to fine-tune job searches, keeping your leads focused on specific niches.
- Smart Custom Questions: Generate AI-powered responses or notify your team via Slack or Telegram for high-value opportunities.
To reduce the risk of account suspensions, Convertix.io uses proprietary automation that mimics real browser and PC activity. Plus, agencies can take advantage of a 14-day free trial to test the system and establish benchmarks before committing to a subscription.
Step 6: Set Niche-Specific Targets and Track Progress
Define Target Response Rates by Niche
Once you’ve analyzed your data and established benchmarks, the next step is setting clear, niche-specific targets. This approach ensures you’re addressing the unique dynamics of each market, rather than averaging results across all niches, which can mask real performance differences.
For instance, if you’re working on Web Development projects involving React or Next.js, aim for a reply rate of 20–30%. On the other hand, for Local Services targeting small businesses, your goal might be a higher reply rate of 35–45%. Budget tiers also play a big role. Proposals in the Starter tier ($500–$1,500) often see reply rates between 24–38%, while Strategic projects ($15,000+) typically have lower reply rates of 12–22% due to the added scrutiny from buyers.
Another key metric to track is Revenue per Proposal (RPP) – the total revenue divided by the number of proposals sent. This metric helps you measure the value of your efforts across niches. For example, landing a single $10,000 project from 50 proposals ($200 RPP) is far more profitable than closing five $500 gigs from the same number of proposals ($50 RPP). Even with a lower win rate, high-ticket contracts can deliver better overall returns.
By setting these niche-specific targets, you create a clear framework for refining your strategy and measuring progress.
Review and Adjust Strategies Regularly
With your targets in place, the focus shifts to consistent monitoring and improvement. Dedicate 30–45 minutes weekly to review metrics for each niche and budget tier. Pay close attention to your speed-to-lead – responding to opportunities within 30 minutes can increase reply rates by 5–10 percentage points. Identify common bid loss factors, such as mismatched budgets, timing issues, or gaps in trust, to pinpoint areas for improvement.
On a monthly basis, spend about 60 minutes updating your Ideal Customer Profiles and refining saved searches. Use this time to evaluate whether smaller, successful projects can transition into higher budget tiers. Additionally, conduct weekly A/B tests on a single proposal variable – like a new opening hook or a different proof format – using 20–30 proposals. Only implement changes that result in at least a 20% lift in response rates.
This structured review process helps you stay agile and focused, ensuring you’re making data-driven adjustments without overreacting to short-term trends.
Conclusion: Key Takeaways for Benchmarking Proposal Response Rates
This guide has explored how niche-specific data can shape and refine your proposal strategies. Benchmarking response rates effectively requires developing a system rooted in data. Start by defining key metrics – such as Reply Rates, Shortlist Rates, and Win Rates – and segmenting your data by niche and budget tier. For example, a web development proposal aimed at a $10,000 project will yield different results compared to a local services bid for $800. Combining these data points into a single average can obscure critical trends.
To establish a reliable baseline, analyze a 60–90 day window with data from 50–150 proposals. If your performance falls short of benchmark ranges, look closely at factors like your proposal openers, proof artifacts, or response speed. Operational metrics, such as maintaining a response time under 30 minutes and improving your Proposal Quality Score, can help identify where your process may need improvement.
"Benchmarks don’t win projects – systems do."
- Vadym Ovcharenko
Consistent iteration is key. Conduct weekly A/B tests, perform niche-specific reviews, and update your profiles monthly. These steps can turn your pipeline into a dependable, results-driven system.
For scaling efficiency, platforms like Convertix.io streamline these processes. Agencies handling multiple niches and budget tiers can benefit from tools that track KPIs in real-time, enforce a 30-minute SLA, and automate follow-up sequences at T+24h and T+72h. This level of operational consistency separates agencies with reply rates of 20–35% from those achieving higher stretch targets of 30–45%. With clean data, niche-specific benchmarks, and automated systems, you can confidently forecast revenue and plan for team growth.
FAQs
What’s the best sample size for reliable benchmarks?
When determining a reliable sample size for benchmarking proposal response rates, aiming for 30 to 50 proposals per niche or variation is a solid approach. This range ensures the data is statistically sound and useful for meaningful comparisons. Starting with at least 30 proposals helps uncover trends, establish practical benchmarks, and guide improvements. If possible, increasing the sample size can boost confidence in your findings even further.
Should I benchmark by niche or by budget tier first?
When benchmarking, it’s smart to start by focusing on your niche. By examining reply rates, shortlist rates, and win rates within specific industries, you can see how your proposals stack up against others in the same space. Once you’ve nailed down these niche-specific benchmarks, take it a step further by breaking them down into budget tiers. Budget often plays a big role in shaping response and win rates, even within the same niche. This step-by-step method gives you sharper insights to fine-tune your approach.
How do I tell if low replies are my niche or my proposal?
Take a moment to measure your reply rates against industry standards for your niche. For instance, Accounting & Consulting typically sees reply rates around 28.18%, while Virtual Assistance averages closer to 9%.
If your reply rate falls short of your niche’s average, the issue might be related to the specific challenges of your industry. On the other hand, if your rate is on par with or above the average but you’re still struggling with responses or conversions, it’s time to shift your focus. Work on refining your proposal content, ensuring it’s highly relevant, and improving your timing to better align with client needs.